


The Digital Twin is a Knowledge (Sub-) Graph
Jochen Hechler of Continental AG and Tim Rathgeber of Conweaver presented a graph-based solution for Continental AG with regard to supply chain and data governance at the symposium ("Automated Enterprise Knowledge Graph for Corporate Data Governance", see [1]). At Conweaver, we have provided other solutions, even entire linked layers as in the case of Daimler, solutions for Volkswagen, General Motors, Bosch, Hella. Some of these solutions have far more than 10.000 active users. Markus Krastel of em engineering and Olaf Kramer of Bosch (Holistic PLM in the age of Systems Engineering and Digital Transformation at BOSCH, see[2]) outline a holistic PLM solution that goes beyond the well established graph-based PLM solution for engineering. However, Gartner still sees Knowledge Graphs as an emerging technology on the verge of breakthrough. The state of Knowlege Graphs has also been discussed by Jörg Werner of Merck, Felix Lösch of Bosch and Vinod Surendran of Deloitte at the smart data blog. They recognize that the Knowledge Graph market is still in its infancy. Vinod Surendran predicts this will change drastically within the next two years. So, be prepared!
The major reason they see is twofold: the technology itself has become mature and the challenges customers face are calling for such a holistic approach. In case of the product lifecycle Knowledge Graphs will have a major impact on the provision of data to the business roles along the process and lightweight graph-based solutions will be tailored to the needs of these roles’ information demand. Thus, Knowledge Graph based solutions will become the actual PLM tools. Authoring tools have never and will never become real PLM tools. This is not what they are designed for, whatever the marketing labelling. In contrast, Knowledge Graph technologies will only see a breakthrough if business orientation drives the technological development, i.e., Knowledge Graph-based solutions must immediately provide value to the business user.
The Lifecycle of Business Objects
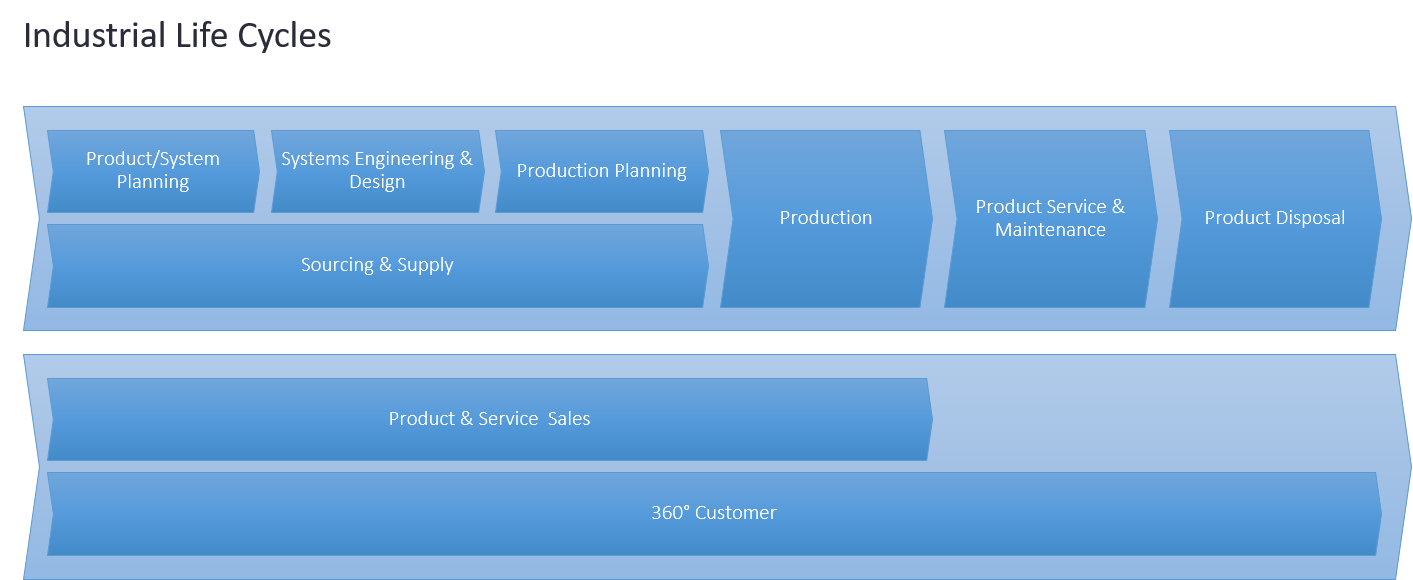
Business users such as engineers, salespeople, procurement staff and others are naturally concerned with business tasks. Regarding IT concepts, the latter lead to the administration of master data concerning products, services, assets, customers, etc. along the value chain. Dedicated processes create, change, and retire the corresponding business objects along different process phases. This is done using specialized authoring systems. In manufacturing the product lifecycle distinguishes phases such as “define”, “design”, “validate”, “plan”, “build”, “inspect”, “operate”, “retire”. Accordingly, the downstream process creates documentation in the form of, e.g., requirement documents, “as-designed”, “as built”, “as-delivered” bill of materials, etc. The documentation is highly interrelated because the object in focus emerges through the different stages. This entanglement, even dependencies, became a challenge as the division of labor meant that different organizational units used different authoring tools so that connectivity was lost, and complexity arose. This is the reason why concepts such as the digital thread and the digital twin have appeared. They embody the need for connectedness, and thus, provision of business context in a consecutive process that is only loosely coupled in terms of data. The downstream, however, contains quite a few feedback loops that even add complexity to the existing one, this trend will yet increase with upcoming service-based architectures and new business models.
Feedback-to-design Loops and the Digital Twin
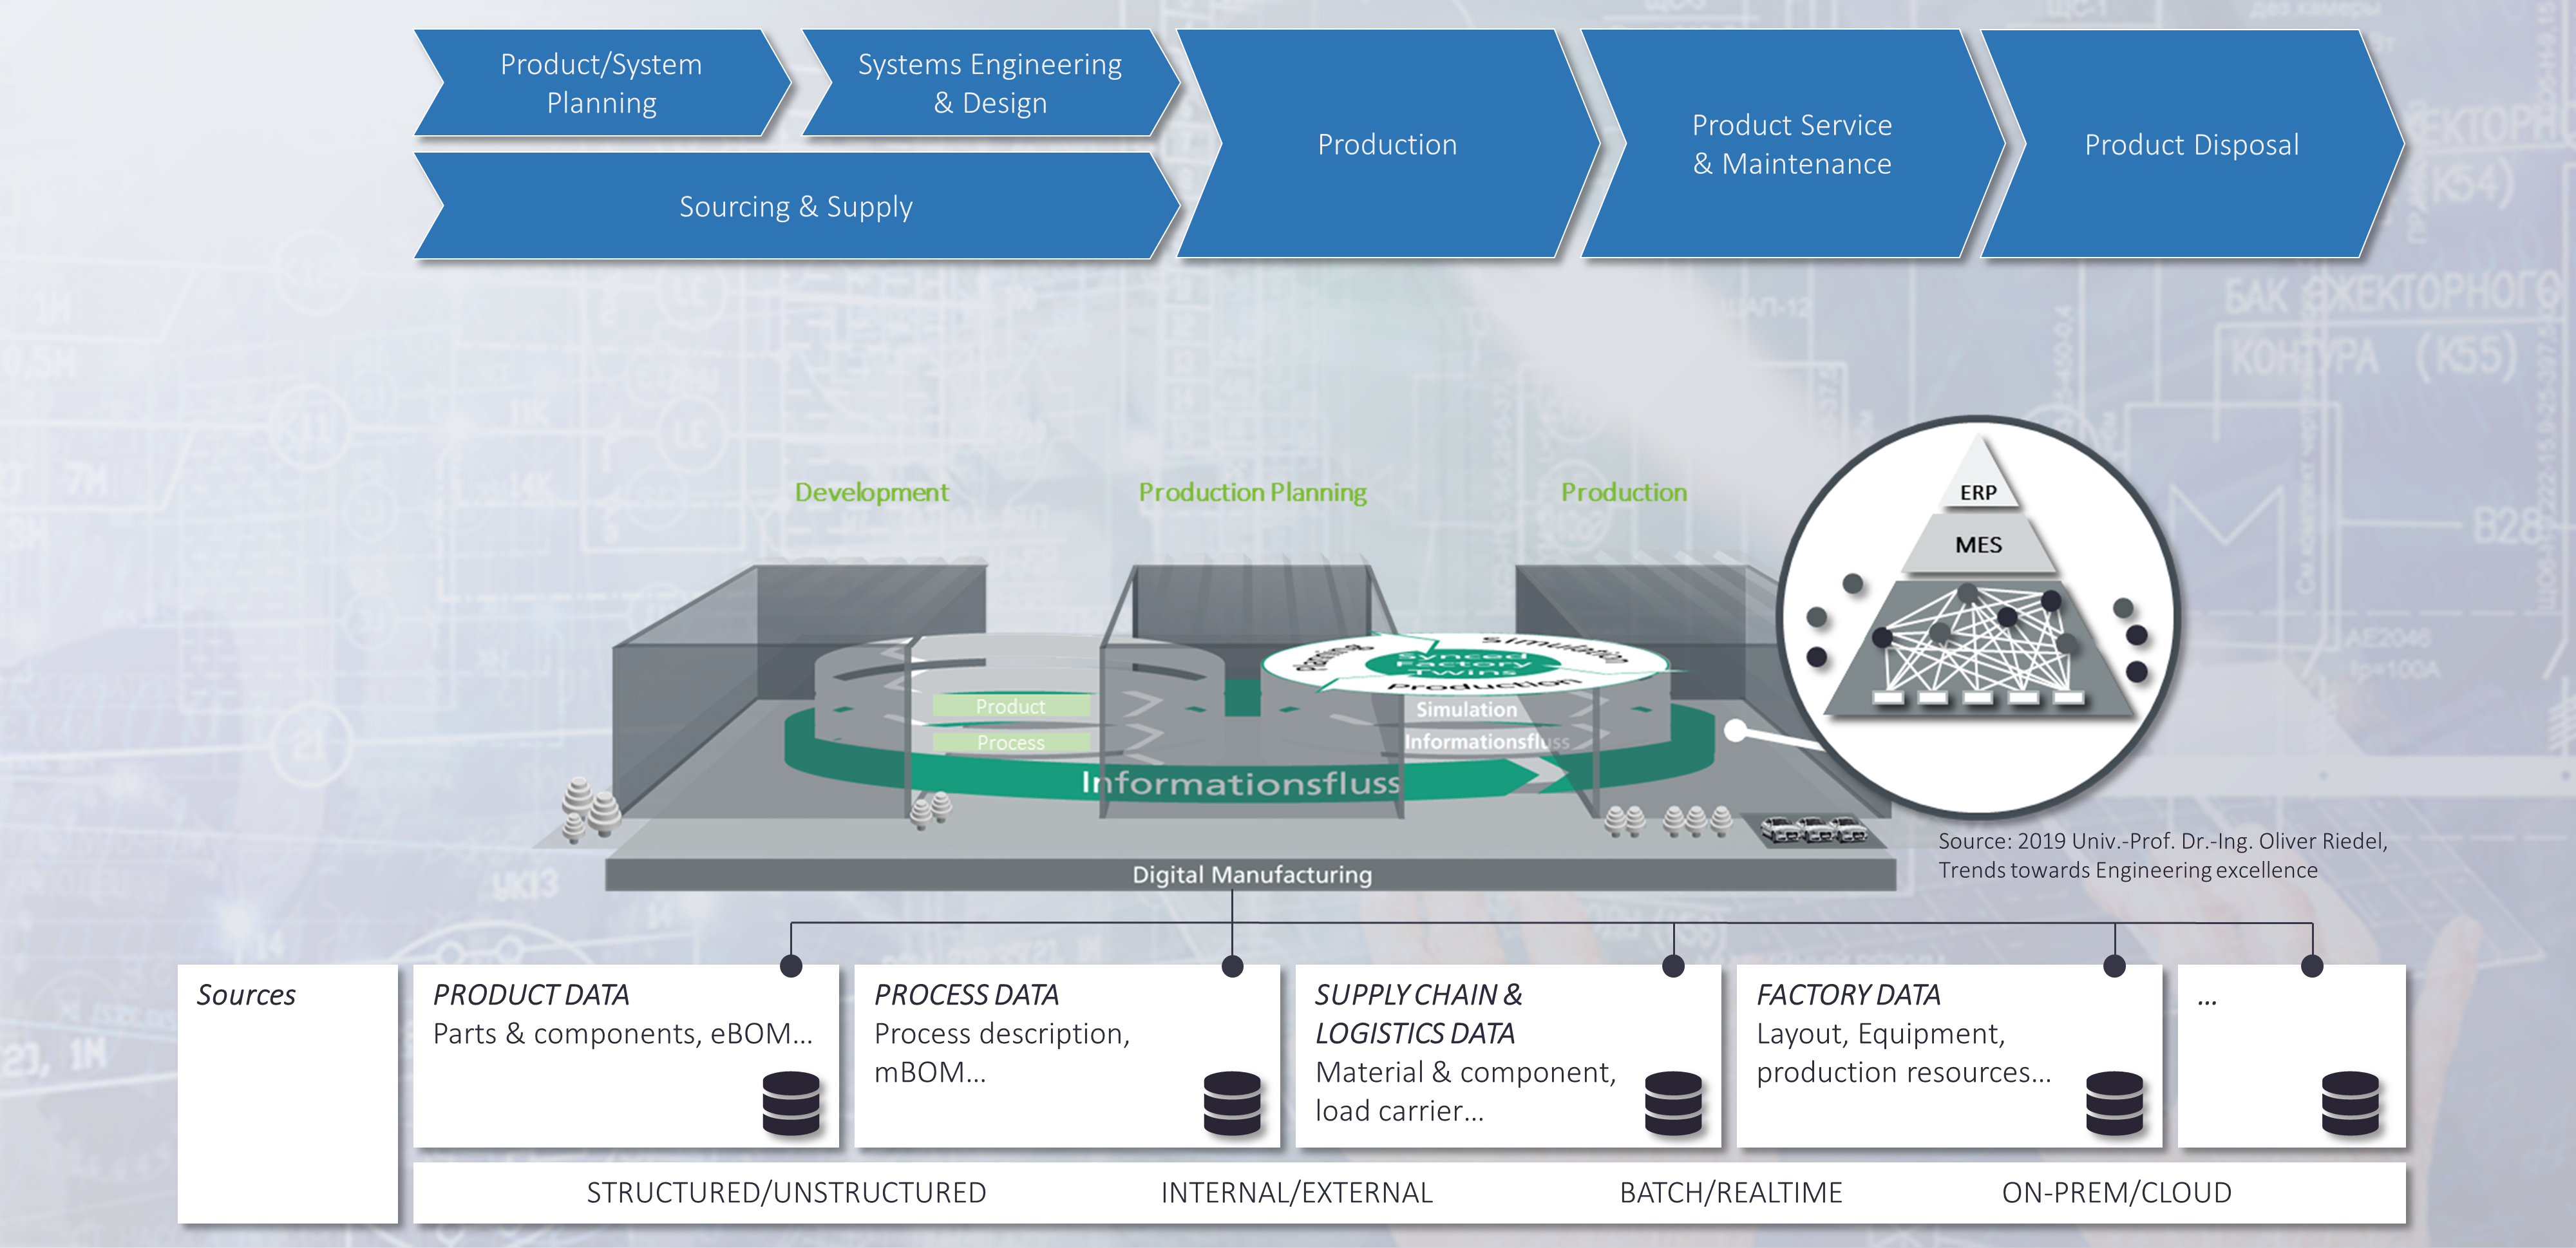
Historically, the digital twin concept has been discussed from the perspective of a physical artefact whose model is missing. Physical products, components, or plants would want to be connected to their model. This could be particularly helpful, e.g., to support tracking, change impact and many other tasks along the process. However, this is a retrospective view on the matter. If we take the stance of model-based systems engineering, then the physical product is just a later instantiation of the digital model in a frontloaded product lifecycle process. Such a prospective way of seeing it has several advantages, e.g. Karsten Klemm of Mercedes Benz AG and Theresa Riedelsheimer of Fraunhofer IPK and have shown in a research project ("Bridging the Gap", see [3]) that feedback-to-design loops help as a holistic means in early phases to leave more room for energy efficiency optimization in production.
%20K.%20Klemm%20%26%20T.%20Riedelsheimer.png)
A key requirement derived from their research states that engineering data and production data (master and shadow data) must become connected to make this method work. This is a contribution to the fact that most companies operate in a brown field. They could show that based on their method different types of product variants were more adequate from the point of view of energy efficiency. They even claim that digital twins may in the future carry out sustainability evaluations. This is a remarkable statement because it claims a digital twin to become an active agent, not just a passively managed object of interest. Prof. Riedel of Fraunhofer IAO has shown that use of frontloading can simultaneously enable an earlier SOP and smooth the transition between engineering and production. This is an important aspect concerning digital manufacturing because as mentioned above, the downstream process is not just a linear process but contains loops. Recently, Matthias Ahrens posted a link to [4] that caught my attention in which Jim Brown of Tech Clarity highlights
two primary value drivers, streamlining engineering and creating digital continuity. More importantly, these factors are the means to significant business improvements. Benefits include improved quality, greater efficiency, lead-time reduction, enhanced innovation, and more. Specifically, our study shows that companies that have adopted a digital thread enable their technical resources to spend 10% more value-added time on innovation, design, and development work.
What is the Digital Twin?
For my taste, digital twin and digital thread are still fuzzy concepts. Different people have different ideas about what these concepts mean. Marcin Humpa of Mahle and Michael Kirsch of em engineering ("Benefits & Challenges of Model-based Engineering & Use of Standards", see [5]) distinguish three consecutive phases along the PLM process: Requirements Engineering and MBSE, the Digital Master and the Digital Twin. In their model the digital twin is closely related to the physical instance of the business object in focus. They argue that document-based development must be overcome in favor of model-based systems engineering methods in which the first step would be to create a digital master. I could not agree more! However, abstract objects such as processes are business objects of interest in their own right. They do not have a physical instance themselves but they go through a similar lifecycle. They are managed using business process managements tools and workflow management systems and, in many cases, they are embedded as the core of application systems. Application Lifecycle Management (ALM) is the business category corresponding to PLM. Driven by market trends PLM and ALM grow closer and closer together. Software development has even become the major driving force for innovation in the manufacturing world. Therefore, it makes sense to look at the digital twin from a more general perspective. Starting from model-based systems engineering and talking into account the phases of the PLM process discussed above with their essential results – the different kinds of documentation maintained in different authoring systems – there are discrete steps in the process, that might be of particular interest, e.g., quality gates that need to be reached. They represent different stages of maturity of a product, a plant, a process, or a software service. The more developed the business object the more views the business roles may want to have along the process. Different perspectives allow specific answers to business questions from different participants.
Enterprise Knowledge Graphs, A Native Means for the Representation of Business Context
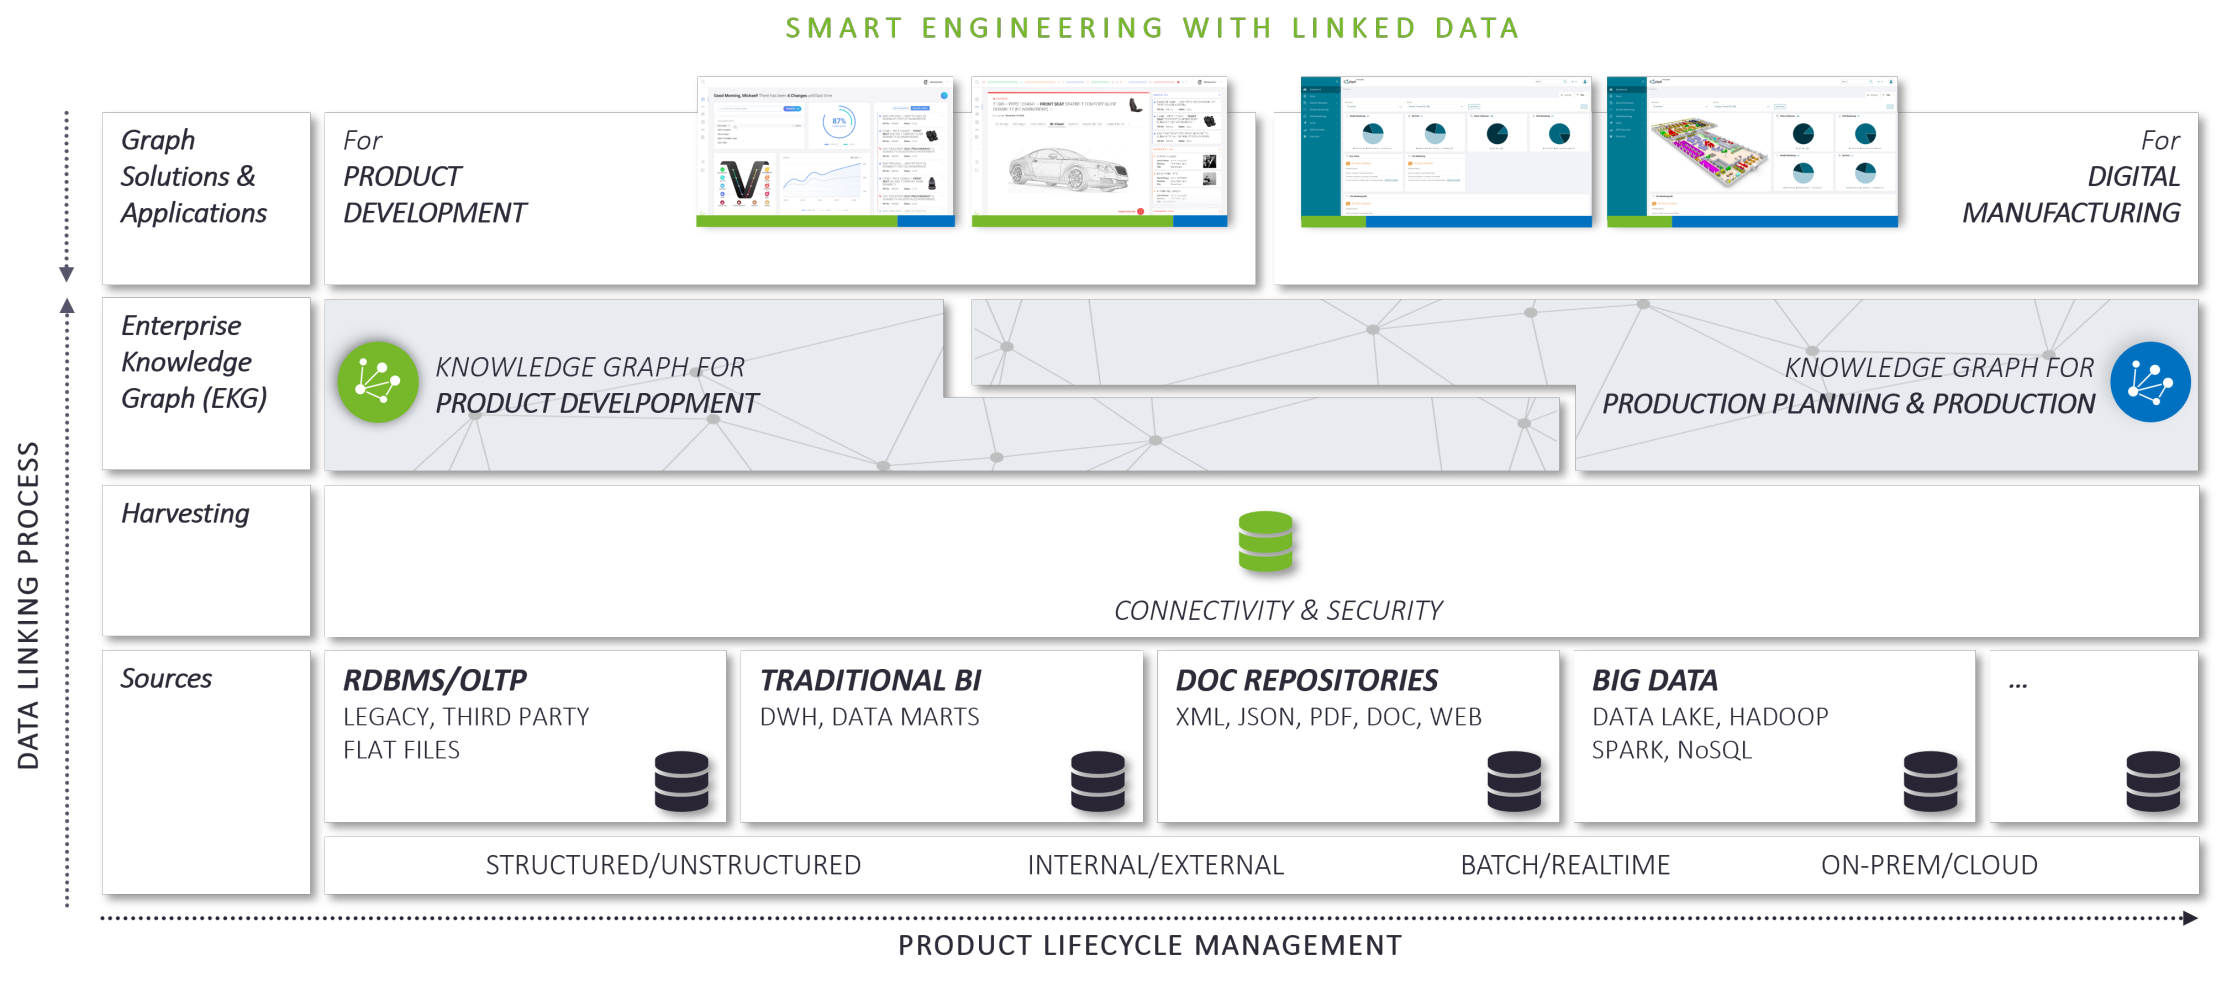
As described in my article "What to Consider if you want to Establish Connected Lifecycles?" (see [6]) EKGs are a native means to represent connected business data. Graph structures in the mathematical sense can represent semantic context information by connecting “nodes” (objects) with “edges” (relations). In an EKG the nodes are business objects of interest whereas the edges represent the correspnding semantic relations connecting them. They can be quickly (incrementally) computed from the brown field in an automated fashion (see [7]) and leave existing data architectures and processes intact. E.g., digital data packages as described in by Ralf Burghoff ("Between 3DEXPERIENCE and 4PEP", see [8]) as well as Marcin Humpa and Michael Kirsch in [5] can easily be the starting point for the automatic creation of EKGs. As such the latter are a very pragmatic means for the establishment of business context, for instance, by means of bridging the gap between the “digital master” and the “digital shadow” as discussed above. EKGs allow for arbitrary views on business objects defined by intelligent graph traversals – query-based, rule-based, browsing. They even enable insights by means of AI-based inferencing techniques and thus reveal hidden correlation or causality.
The Digital Twin comprises the Business Context of a Business Object from Start to End
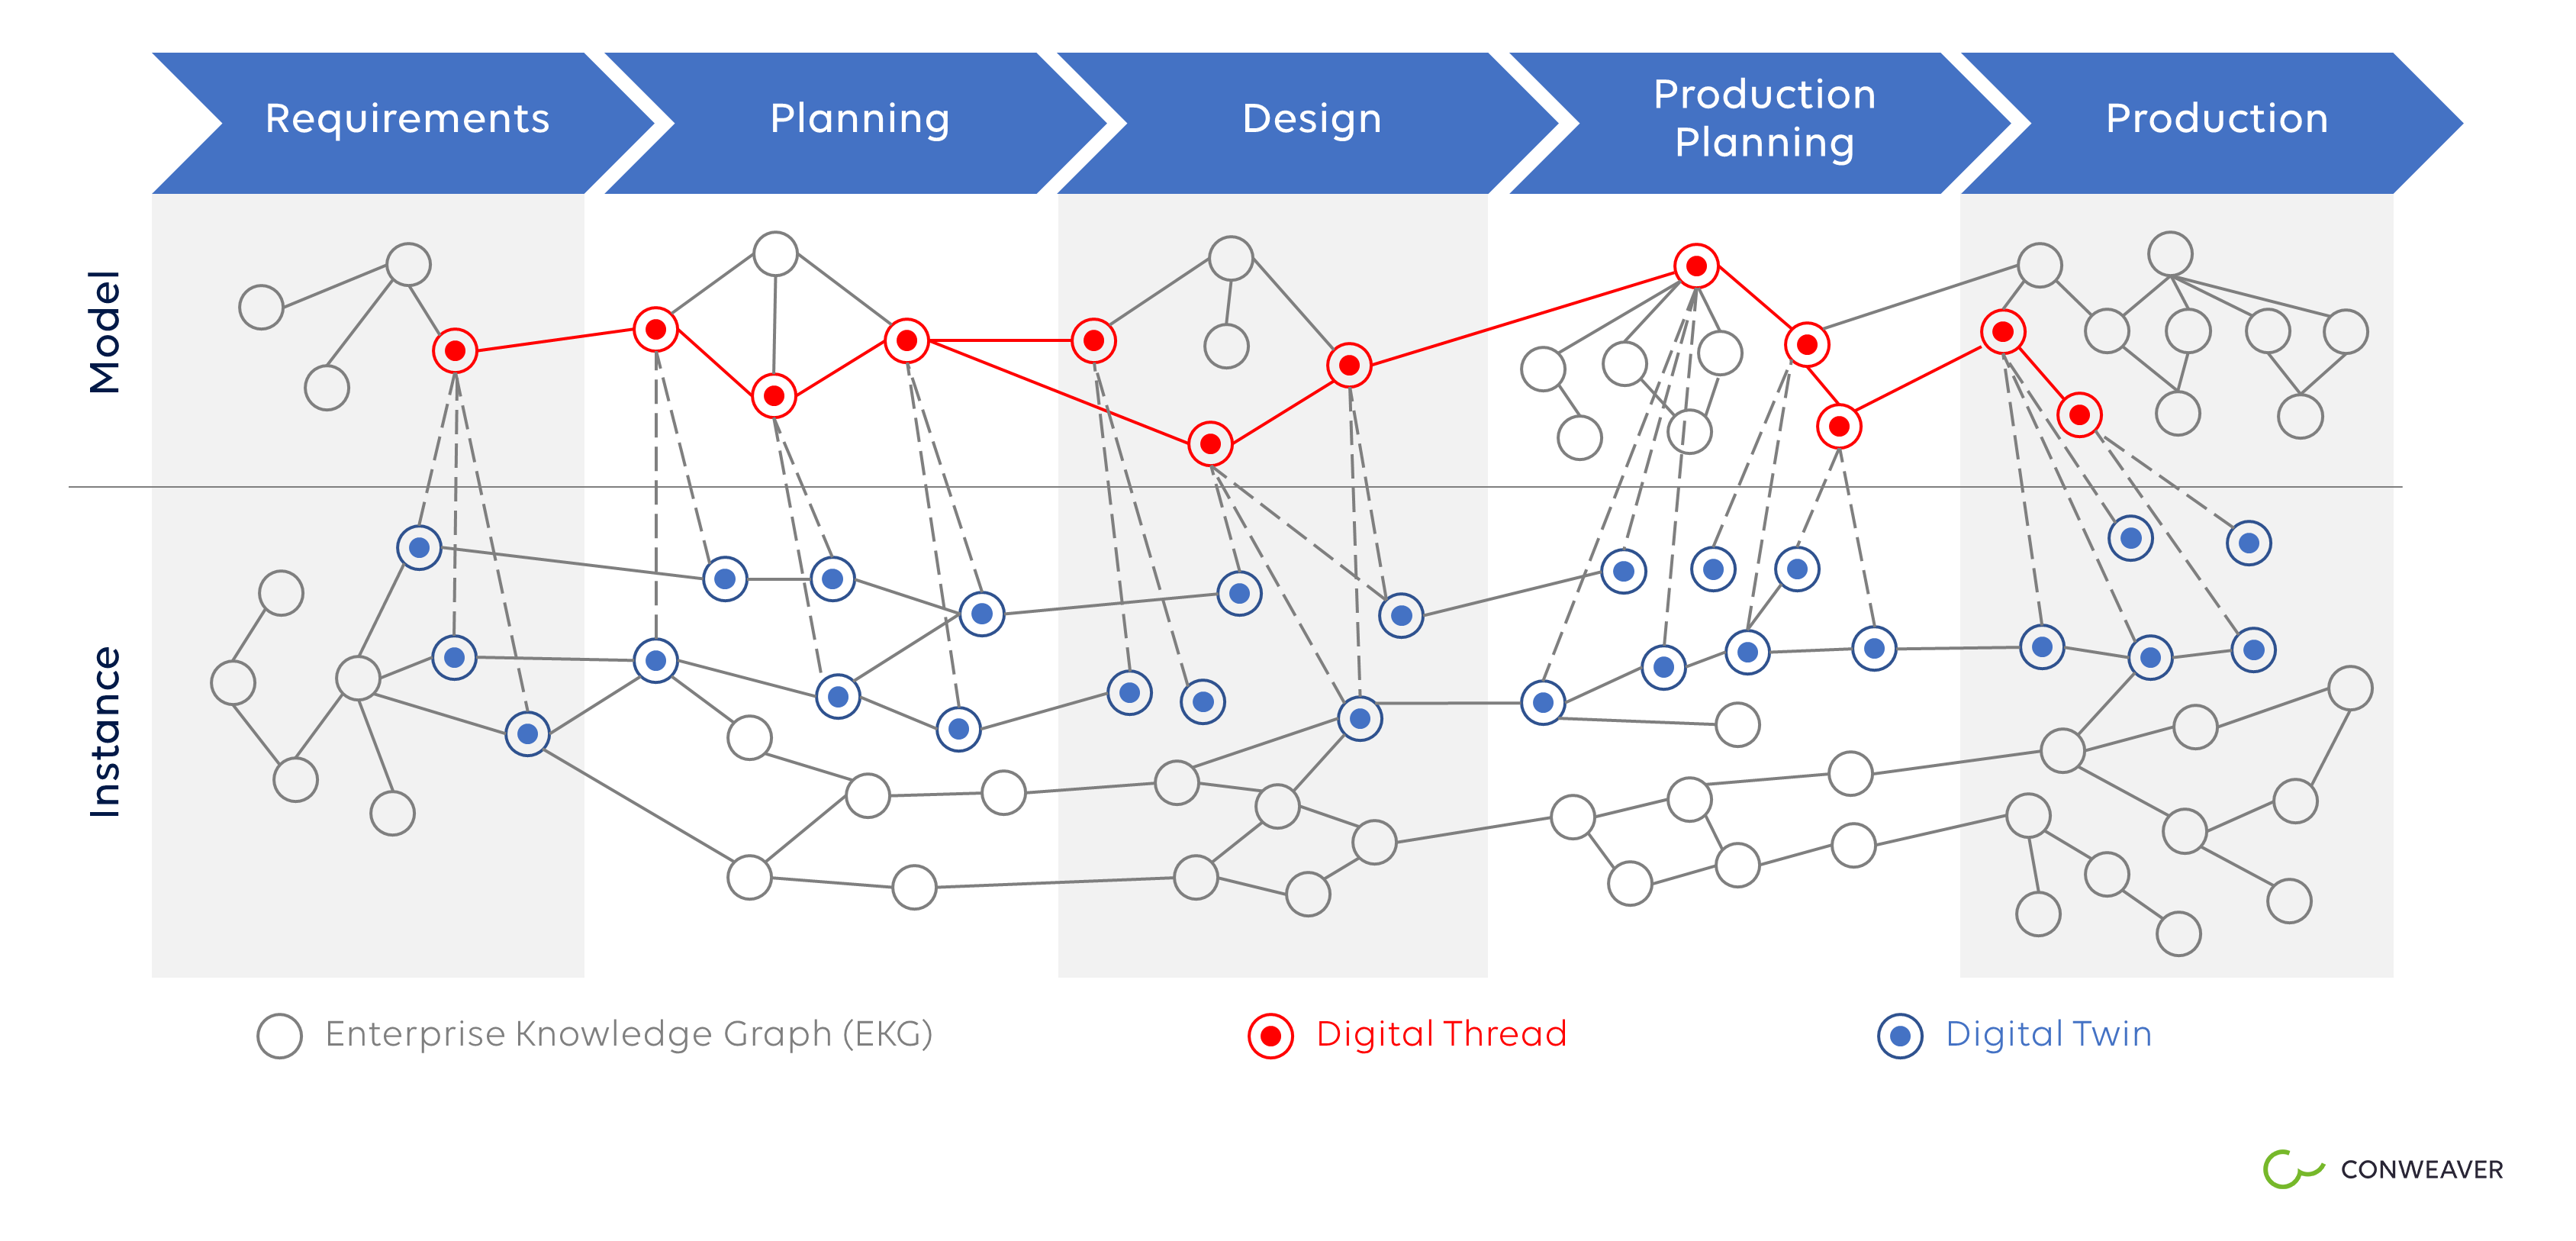
From the discussion above a digital twin is a complex entity that evolves over time along the product lifecycle, transforming into physical instances that are shipped and produce sensor data. A digital twin never dies unless its data gets deleted. And therefore, the structural aspects of the digital twin may very appropriately be repesented by means of an EKG. A digital twin comprises many more non-structural aspects such as simulation programs or digital prototypes used to study the behavior of a physical instance in advance. But from the point of view of the process they are just data connected to other data along the process. If we see the entire business context of a product, process, plant from start to end as the digital twin of this object then the digital twin is a subgraph of an EKG. That is, a digital twin is a graph whose set of nodes is a subset of the EKGs set of nodes and it’s set of edges is a subset of the EKG's. Therefore, different digital twins might have intersections, share common business objects and relations. A digital thread represents the model of a digital twin, its abstract description from which instantiations may be derived. This is much in accordance with the definition given in Wikipedia [9]. Such concepts then allow the specification of the digital twin examples mentioned in ([10], “Rise of the digital twin”) by Uwe Uttendorfer of Mercedes Benz AG and Oliver Hornberg of Unity AG by means of subgraphs of EKGs.
- buildable vehicles: logical formulae for the construction of a digital twin instance
- physical/built vehicles: instances of digital twins
- parts and components: instances of digital twins
- digital prototypes: instances of digital twins
- customer configured vehicles: instances of digital twins
EKGs and Ontologies: Horizontal vs Vertical Structure
Because normalization is supposed to make things easier the introduction of standardization has since been a driver in technological development. Business ontologies are an expression of this endeavor. They are concerned with the standardization of data. Business ontologies represent rather static domain knowledge about processes, software, mechanics or other domains as described by René Bielert and Tamara Hofman ("A cross-disciplinary information model for interdisciplinary collaboration", see [11]). In contrast to vertical business ontologies EKGs represent dynamic, horizontal structures. They are perfectly suited to connect business objects of interest along processes. In this way they are a great tool that can support cross-domain (mechanics, electronics, software), cross-process, and even cross-enterprise transparency. Both structures go well together because they are graphs with possible intersections. Thus, domain ontologies can easily become part of the EKG's underlying data model or nodes of the graph itself. The latter essentially depends on the graph's design.
EKG-Based Solutions
Technical Requirements
Knowledge Graphs and digital twins enable seamless recording of content along the lifecycle by collecting metadata form the authoring systems and connecting them to one another. Due to the sheer size of the data volume, the complexity of the interrelationships and the rapid availability, it is an important requirement to achieve this in an automated manner. Thus, a scalable Knowledge Graph platform needs low code analytics capabilities that enable generative construction and updating of graphs. By large scale I am referring, both, to storage capability, more than 1.000.000.000 of objects and a multitude of links for a single solution, and to large number of users, in the order of >10.000 actively working on the solution at the same time. This will guarantee quick delivery of the solution and high productivity for the user as requirements of customer value. At the same time size is a relevant differentiator compared to ontologies which are typically manual work and thus limited in size.
Design Principles for Knowledge Graphs
In a data-driven economy it should be a design principle to make use existing data as much as possible to offer added value to the customer and leverage investments made. Another design principle should be to burden the customer with unnecessary tasks as little as possible. For this reason we Conweaver advise our customers to follow a bottom-up incremental design of the Knowledge Graph instead of a top-down approach. Bottom-up means taking the IT landscape as it is, instead of putting a supposedly clean superstructure (data model/ontology) on top that is guided by a standardization idea. Three reasons why: 1. The bottom-up approach delivers value very quickly and leaves established processes intact. 2. In our approach standardization does not come by imposing structure but by abstracting from the concrete data landscape and processes. We see IT vendors requiring OSLC-based linking of the lifecycle. Nevertheless, this is just another way of burdening customers with top-down standardization that urges them to properly label their data to make it easy for IT solution providers to collect and map the data. We think it should be the software vendors' burden to provide appropriate analytics tools instead. (I love PTC's very analytic approach to the linking of the product lifecycle but pdm + OSCL might a problematic answer to the challenge, see What to consider if you want to establish connected lifecycles) 3. Changes of the landscape can easily be made under the "umbrella" of the Knowledge Graph once it is established. This relates to the fact that data migration processes may strongly benefit from an abstraction layer as it is represented by an EKG.
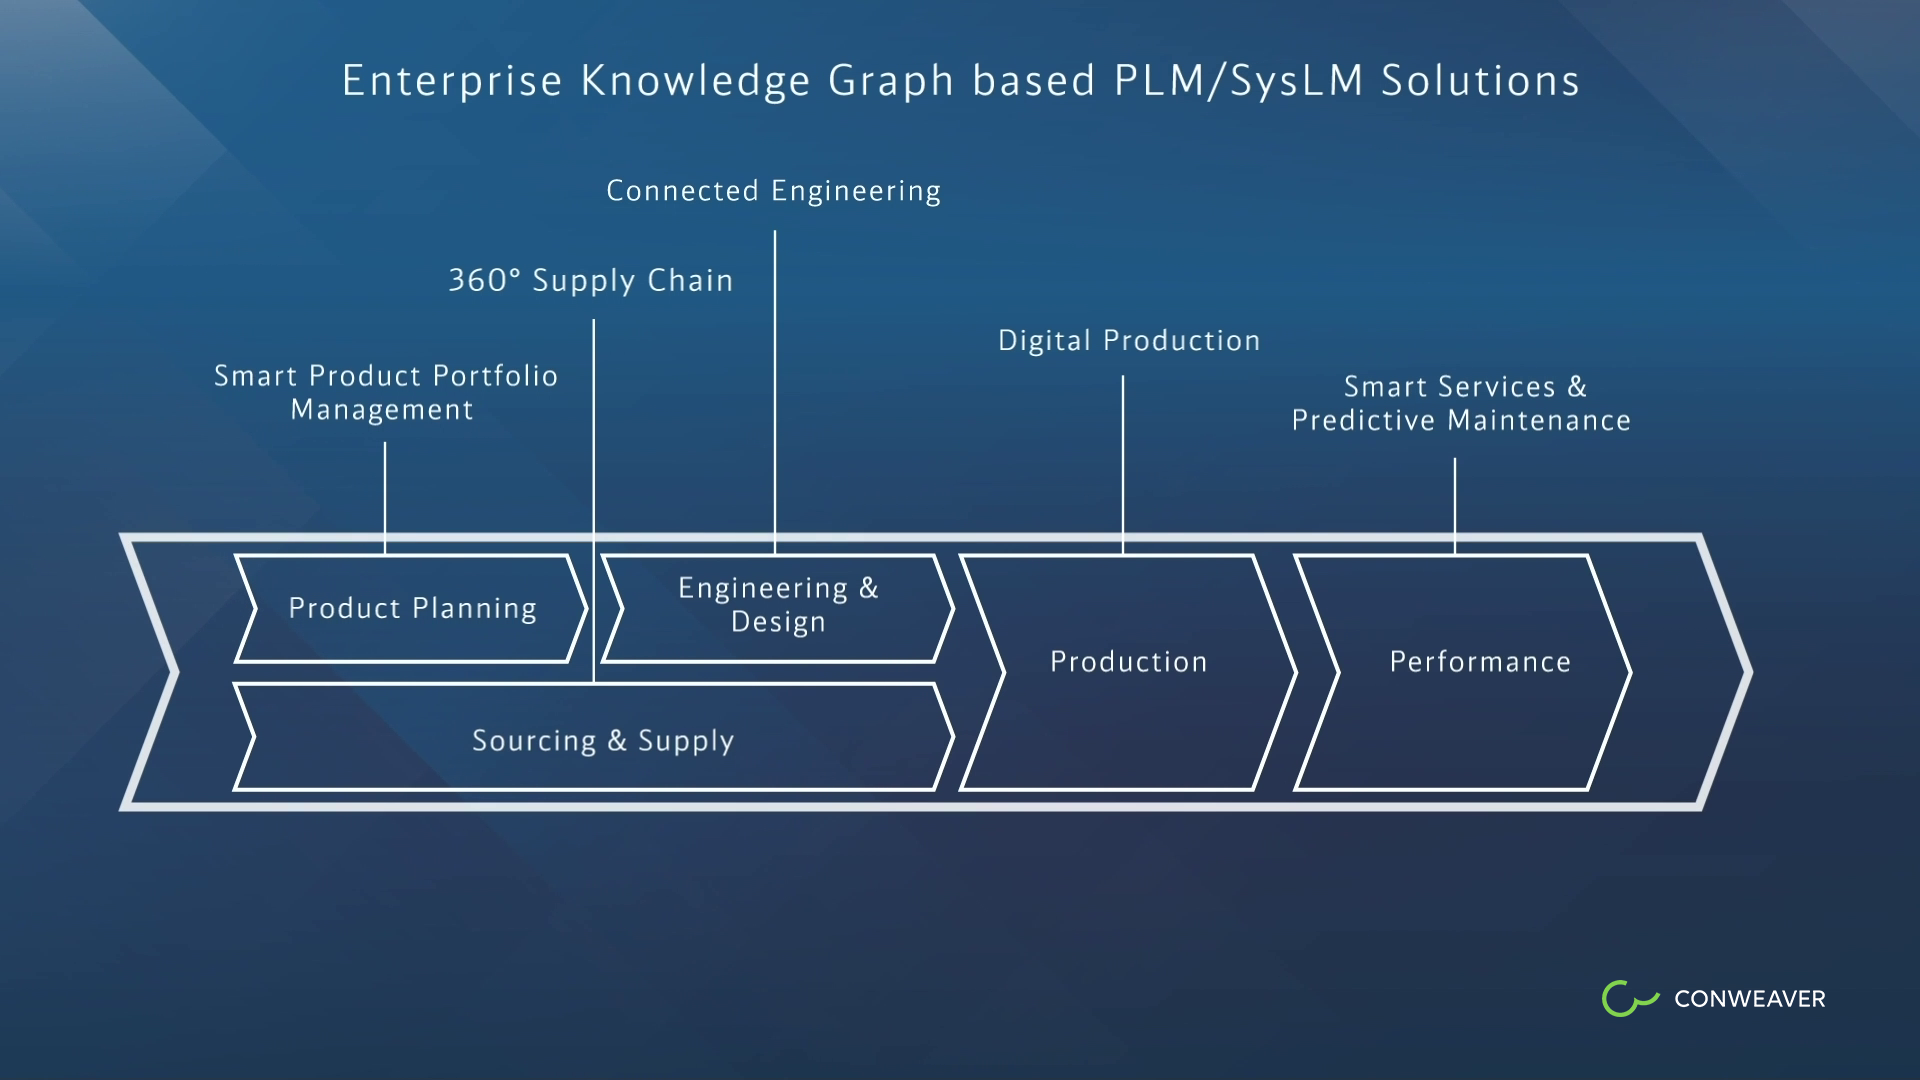
Tailoring Solutions across the Lifecyle
A further benefit of the incremental bottom-up approach is that specific solutions for specific roles can be designed in advance which does not preclude but encourages adding of further solutions that share or extend the same EKG. They range from product portfolio planning and systems engineering tasks such as change impact analysis, root cause analysis, project status analysis and reuse of components to digital production, smart services and 360-degree supply chain solutions. In our video with Continental AG we describe a 360-degree supply chain solution (see [1]), and in the case of Bosch we have developed an enterprise PLM solution that's running productive since 2014 with far more than 10.000 users. For Daimler we have provided a Linked Data Layer to support numerous graph-based solution on top of it, and the same for other customers.
EKGs and Analytics are Siamese Twins
If you want to provide scalable EKG-based solutions as outlined above then strong configurable analytics and EKGs are Siamese twins themselves. This results from the fact that the data from which the EKG gets computed is available in large quantities, has a heterogeneous structure and is inconsistent across the different authoring systems. Together with machine learning methods EKGs form the building blocks for every type of (predictive) data evaluation of the future, because they bring analytics and structure into the synthesis and allow for deep insights into the mechanics of the business. A major factor of success thus consists of the analytics platform's technical capabilities that are used to compute the graph in combination with an experienced team of data analysts and knowledge graph solution designers. In most of the cases solution providers offer a graph database in which they can store and maintain graphs. The bulk of the work is however connected to complicated data preparation procedures to achieve sound and consistent data to start with. Thus, knowledge graph platforms that show a weakness here will promise a lot of tedious manual work in maintaining and adapting the solutions. Purely editing-based knowledge graph platforms are therefore limited in their use.
For more insights see also my other graph related LinkedIn articles
- What to Consider if you want to Establish Connected Lifecycles?
- New OEMs Business Models Change Product Development from Head to Toe
- Operating Systems will Empower Systems Engineering
- Gartner Emerging Technologies: Knowledge Graphs Become Central Component for Data Fabric
- Does conceptional confusion lead to a search for a new label for PLM?
- Linked Data Connectivity – Graphs are the Crux of the Biscuit
Header picture taken from © mammadzada.rashad@gm / adobestock 310074704


